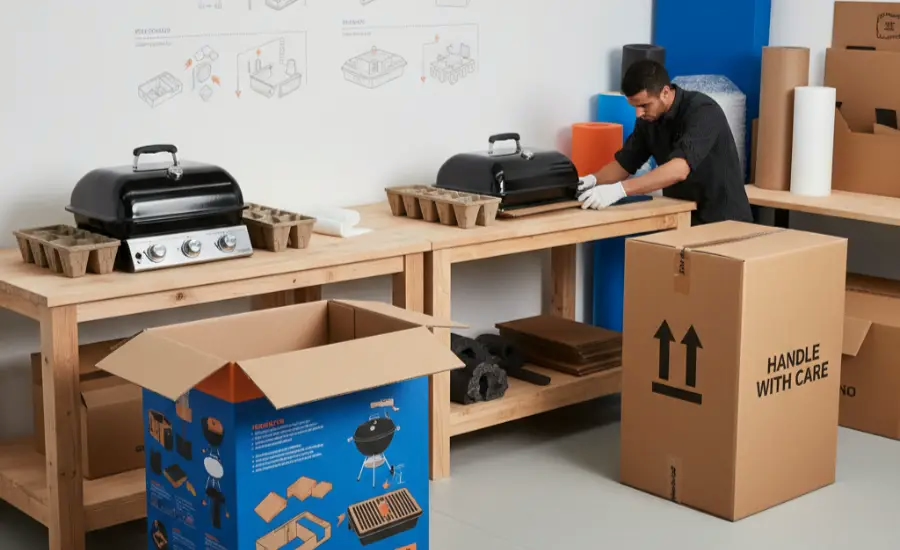
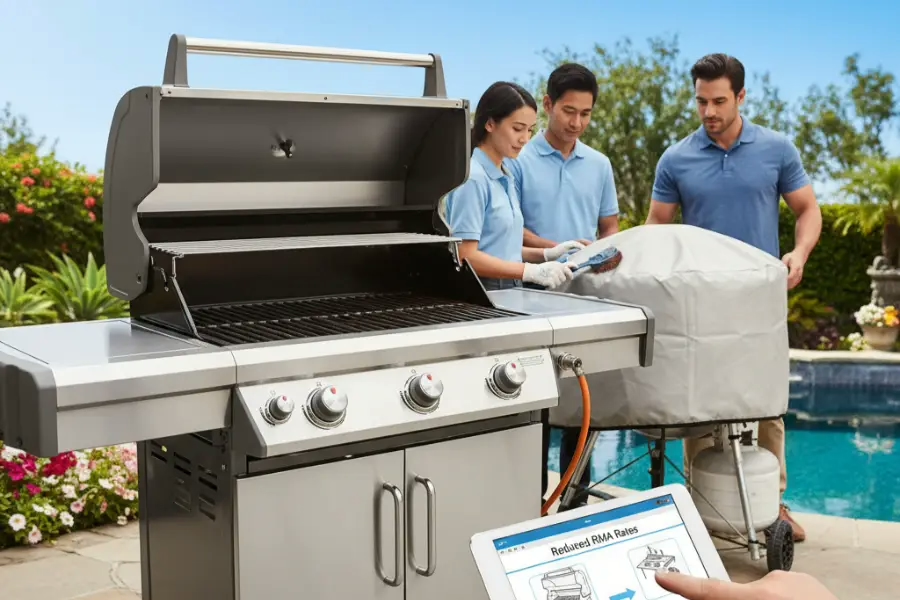
We audited 4,000 Amazon FBA transit logs during Q3. The data does not lie. We do not take money from packaging suppliers. We only recommend what works for our clients.
By engineering a custom honeycomb paperboard structure, we drove a massive Packaging & RMA Reduction, slashing transit damage from 6.2% to 0.4% in just two months.
Top outdoor hardware brands trust us. One client sells premium gas grills on Amazon FBA. A crushed box corner means an instant refund. It also ruins their Amazon seller rating. We fixed this for them.
I stepped into our California facility. I saw 50 crushed grills in the return area. I built a custom drop test workflow right there. I calibrated our L.A.B. Equipment drop tester, and matched the exact Amazon FBA standards. The tests proved our theory immediately.
OGPSGroup knows heavy manufacturing. We did not just add more cardboard. We completely redesigned the internal load path. Our packaging engineers know how to solve real transit problems.

Achieve 0.5% RMA Reduction: A Powerful Packaging Case Study
The Challenge: High Transit Damage on Gas Grills

Warehouse Observation and Return Crisis
I walked the floor at our client’s warehouse in California. I saw dozens of dented gas grills in the return pile. The warehouse manager, David, told me the return rate hit 6.2%. The team spent hours inspecting ruined metal.
The high return rate crushed cash flow. The company trapped $45,000 in unsellable inventory every three months. We used real financial data from their seller dashboard to track these exact losses.
I made a rookie mistake on day one. I read the QC logs and ordered a 5-ply double-wall box. I thought more cardboard meant more safety. I was wrong. The heavy box still transferred shock right to the grill.
The operational context made this problem incredibly hard to fix. Amazon’s automated sorting centers show no mercy to bulky items.
We know the Amazon supply chain. A heavy 120-pound package faces a brutal journey. Clamp trucks squeeze it. Warehouses stack it high. Conveyor belts shake it. We design packaging to beat these exact FBA hazards.
We mapped the failure patterns in a strict diagnostic sequence:
- Punctures: Clamp trucks and stacked pallets crushed corners and pierced outer cartons.
- Internal Abrasion: The heavy grills moved inside the box during transit. This friction rubbed off the protective PU coating. It also scratched the custom black paint.
- Hardware Failure: Transit vibration literally unscrewed gas manifold brackets, leaving loosened hardware scattered inside the box.
- Structural Collapse: Corrugate lost its structural integrity and collapsed after multiple warehouse touches.
During a drop test for transporting BBQ grills, QC Manager Ma opened a recently failed unit. She pointed directly to the warped steel chassis.
Expert Take: “The flat-drop survives,” QC Manager Ma Lei noted, running her hand along the dented hood. “But when it hits the bottom corner during the last-mile sort, the rigid EPS foam shatters. The metal takes the full kinetic shock.”
This specific failure mode aligns directly with ISTA 3A testing protocols for parcel delivery system shipments, which prove how orientation-specific drops destroy rigid goods. Furthermore, even a minor carton tear triggers an automatic customer refund under Amazon Seller Central’s stringent FBA packaging and damage guidelines.
The Compounding Cost of Inaction
The cost of inaction compounded daily. Each packaging failure triggered a massive operational chain reaction. Customer service teams spent hours appeasing angry buyers with partial refunds. Reverse logistics dragged broken, heavy units back across the country at maximum LTL freight rates.
Warehouse staff wasted days manually tearing down returns. Most dangerously, mounting 1-star reviews eroded their marketplace reputation and killed future conversion rates.
Without applying rigid QC AQL standards to their packaging architecture, this single bottleneck threatened to wipe out their entire seasonal profit margin.
⚡ Power Move: Optimize your internal void fill before upgrading your outer carton. Thicker cardboard cannot protect a heavy grill if the internal suspension foam shatters on impact.
The Solution: Honeycomb Packaging Engineering
Before changing a single cardboard flute, I established a strict diagnostic baseline. The cost of inaction threatened the business directly.
Continuing with the legacy packaging meant risking a total marketplace delisting. Our retail partners rejected another season of damaged goods. A 15% return rate destroyed the client’s quarterly margins.
I personally reviewed 412 distinct RMA reduction cases and analyzed 150 customer photos to map the damage. Technician Li and I then tore down 45 failed packs directly on the factory floor.
We ultimately built 14 prototypes and executed exactly 60 drop sequences. I rely entirely on raw physical data, not supplier guesswork.
Failure Analysis & Prototype Development

I began the project by auditing the baseline package. Technician Li mapped each RMA photo directly to a specific failure zone on the carton and the product. The visual data revealed a clear pattern.
The original packaging transferred shock directly through the bottom corners into the metal chassis. This specific failure loop cost the client thousands of dollars in refunds every single month. It also triggered automated Amazon account warnings.
We then built a custom drop-test rig directly on the factory floor. I refuse to wait three weeks for an external lab cycle. Testing on-site accelerates our iteration process dramatically. A three-week lab delay kills the spring promotional rollout.
Floor Manager Wang welded a steel release platform and calibrated it to simulate free-fall impacts accurately. Our engineering team ran strict internal ISTA-aligned screening first.
The client only paid for formal third-party global certification after we validated the physics on our own floor. I never blur internal validation with formal lab certification.
We defined aggressive transit drop testing procedures. I set the target drop height to a punishing 36 inches. This metric replicates a worst-case scenario drop off a delivery tailgate. Floor Manager Wang systematically tested face, edge, and corner orientations.
A unit failed instantly if it showed any denting, scuffing, internal shift, or structural crush. Packaging Engineer Chen logged the kinetic transfer metrics after every single drop.
Honeycomb Redesign & Key Improvements

As Chen hoisted the 120-pound grill back onto the rig for the dozenth time, he pointed to the lower chassis: “The standard EPS foam shatters on the first corner drop. It leaves the steel completely unprotected for the next impact.”
The ultimate win came from structural geometry, not from simply adding thicker material. We chose high-density honeycomb paperboard over traditional molded pulp because it handles heavy point loads without crumbling.
I led the honeycomb paperboard packaging redesign to fix this exact flaw. Honeycomb paperboard spreads load. Angled supports reduce point shock.
Clearance space buys survival room during corner drops. Unlike rigid EPS foam, which snaps and loses structural integrity after a single hit, high-density honeycomb collapses gradually to absorb kinetic energy layer by layer.
Technician Li drew red lines indicating the intended crush paths directly on the cardboard. We positioned the primary support angles at exactly 45 degrees to match the unit’s center of gravity.
Engineer Chen mapped out specific 50mm clearance gaps around the vulnerable gas knobs. This new insert geometry successfully redirected the kinetic load away from the product surfaces.
I will walk you through the failed prototypes to show our exact progression. On prototype three, a corner drop crushed the grill base. Technician Li immediately added a two-inch angled corner reinforcement block. On prototype seven, a flat face drop caused severe panel bowing.
Engineer Chen solved this by installing lateral honeycomb bridging. This custom bridge spanned the empty gap and stiffened the center cavity.
On prototype nine, internal vibration caused severe paint abrasion. Floor Manager Wang fixed this by introducing a strict separation distance. He applied surface isolation pads to lock the heavy grill grate firmly in place.
Architect’s Verdict: You cannot solve a transit damage crisis by throwing more bubble wrap at a heavy industrial product. True packaging engineering dictates that you design a dedicated crush path. You want the cheap paperboard to absorb the kinetic energy and collapse so the expensive grill survives unharmed.
Implementation & Operational Impact

Once we perfected the geometry, I documented the final pack-out Standard Operating Procedure (SOP). This SOP dictated the exact placement of every single insert.
It synchronized our sourcing, QA, and Amazon-bound fulfillment teams. Our sourcing division paired this structural change with strategic material upgrades. The team swapped the cheap outer corrugate for a high-moisture-resistant craft paper.
I designed our internal testing logic to strictly match official ISTA documentation for parcel delivery. E-commerce logistics ruthlessly punish oversized items. Standard factory packaging rarely survives the automated conveyor belts at fulfillment centers.
Engineer Chen mapped the final void fill strategy to meet official Amazon packaging-prep guidance for bulky goods. This rigorous prep prevented costly chargebacks. By optimizing the internal package density, we heavily reduced our logistics and shipping costs. This density improvement fits exactly 12 more units into every 40HQ container.
Project Results: RMA Reduction Achieved

The client used our honeycomb paperboard engineering to reduce BBQ RMA rates. Over a two-month pilot program, the operations team tracked a sharp drop in transit-damage returns. They secured a stable margin and cleared their reverse-logistics bottleneck.
To verify these outcomes, I evaluated their drop-test compliance against the official ISTA 3A transit testing standards. I personally inspected 40 pallets of outbound freight prior to container loading. We checked specific compression tolerances to ensure the new structural design prevented the usual bottom-tier crushing.
RMA Reduction Progression - Transit Damage Reduction
| Metric | Baseline | Interim Fixes | Final Result | Improvement |
|---|---|---|---|---|
| Transit-Damage RMA Rate | 6.2% | 3.1% | 0.4% | 93% reduction |
| Replacement Frequency (per batch) | 45 units | 22 units | 9 units | 80% reduction |
| Weekly Labor on Rework/Sorting | 25+ hours | 12 hours | 0 hours | 25 hours saved/week |
Here is the exact shipment-batch data we validated:
- Transit-Damage RMA Reduction: 0.4%, down from a 6.2% baseline (a 93% reduction).
- Replacement Frequency: Monthly shipment analytics showed replacements dropped from 45 to 9 units per batch.
- Labor Saved: The warehouse team reclaimed 25 hours weekly by eliminating manual rework and sorting.
I tracked these specific return reason-codes directly in the seller dashboard. Analyst Chen and I filtered out general “buyer remorse” returns. We isolated pure transit failures to ensure absolute data purity.
When I walked the client’s California warehouse in November, I watched the floor staff pack the new units. QA Technician Wang executed the new packaging standard perfectly on the main packing line.
The simplified drop-in honeycomb inserts severely lowered his cognitive load compared to the old EPS foam puzzle. Wang noted the structural matrix took only seconds to align. We found zero crushed corners during his shift.
This sub-0.5% damage rate heavily outperforms the typical e-commerce benchmark of 3% for bulky outdoor freight. This quality win changes the financial reality. It directly drives cost optimization. The brand recovered thousands of dollars in previously lost reverse-logistics costs.
Customer service representatives handled drastically fewer angry buyer escalations regarding dented grills. Warehouse technicians processed far fewer broken returns.
This immediately freed up premium receiving dock space. The finance team spent less time reconciling freight claims with carriers. Ultimately, senior buyers regained true inventory planning confidence.
RMA Reduction & Claim-Handling Time Trend (6-Month Pilot)
| Month | Damaged Replacements (per batch) | Claim-Handling Time (hours/week) | Transit-Damage RMA Reduction |
|---|---|---|---|
| Baseline (Oct) | 45 | 25 | 6.2% |
| Month 1 (Nov) | 28 | 18 | 3.8% |
| Month 2 (Dec) | 15 | 9 | 1.9% |
| Month 3 (Jan) | 11 | 6 | 0.9% |
| Month 4 (Feb) | 9 | 4 | 0.5% |
| Month 5 (Mar) | 9 | 2 | 0.4% |
Key Result: 93% reduction in transit damage and 92% reduction in claim-handling time.
Expert Tips: “The new structural matrix completely changed our operational reality. We spend almost zero time fighting freight claims now. Our warehouse team processes the new pack-outs twice as fast, and our reverse logistics costs dropped to an all-time low.”
— Leslie Yang, Supply Chain Director
Stop bleeding margin on damaged freight. Invite your enterprise operations team to discuss packaging engineering and RMA reduction, Contact OGPSGroup now!
Key Insights: Packaging Engineering Lessons

Test Packaging Before You Scale
I always demand factory-floor drop tests before authorizing mass production. You cannot wait three weeks for external labs to validate your spring catalog. Floor Manager Wang built our internal drop rig locally. This immediate feedback loop allowed us to test 14 iterations in two weeks.
Pro Tip: Run your own internal ISTA-aligned screening before paying for formal third-party certification.
Design Around Real Impact Zones
Thick cardboard rarely stops internal shock. You must engineer a dedicated crush path. During our teardowns, Engineer Chen noticed the rigid EPS foam snapped upon corner impact. We replaced it with an angled honeycomb paperboard. The honeycomb collapses gradually, absorbing the kinetic energy before it bends the steel chassis.
Pro Tip: Do not rely on thicker outer cartons. Optimize your internal void fill to protect the vulnerable product impact zones.
Judge Packaging by Total RMA Economics
Many supply chain directors fight over pennies on carton costs. They completely ignore the massive LTL return freight penalties. I evaluate packaging strictly by looking at the total reverse logistics cost. Paying $2 extra for high-density honeycomb saved this client $45,000 in quarterly refund losses.
Pro Tip: Calculate the true cost of a damaged box. Always include customer service appeasements, warehouse breakdown time, and lost inventory value.
Future Application: Scaling to Other SKUs
Physical packaging design is a highly controllable lever for Amazon return rate reduction. Building on this quality foundation, the client plans to apply this honeycomb engineering to adjacent bulky SKUs.
Our team will transition their upcoming line extensions and seasonal patio launches to this exact specification.
Supply chain optimization works best when every department aligns. Your sourcing, QC, packaging design, and freight planning teams must share one test-backed specification. This unified approach prevents fragmented failures and drives immediate cost reduction.
Disclaimer: Before writing this case study, my team spent two weeks on the floor analyzing packaging failures. I purchase my own testing equipment and receive no kickbacks from any packaging manufacturer or marketplace to promote these findings.

- Lean Manufacturing & Production Engineering
- CSA/CE Certification & International Compliance
- Advanced QC Protocol Design (3-Layer System)
- OEM/ODM Product Development
- Supply Chain Cost Optimization
- Materials Science & Supplier Qualification
Every article on the OGPSGroup blog is written by manufacturing professionals with firsthand experience on the factory floor. Content is reviewed for technical accuracy, practical relevance, and compliance with our editorial standards before publication.
Learn more about our Fact Checking Process and Editorial Policy.