
The Proof,
In The Numbers.
Real-world supply chain transformations — how brands eliminated fragmentation, reduced costs, and scaled through strategic manufacturing partnerships.

Every Result,
Documented.
Some client names are withheld under NDA. Every figure below is reported in the matching case study — defect rates, yields, schedules and margin, before and after.
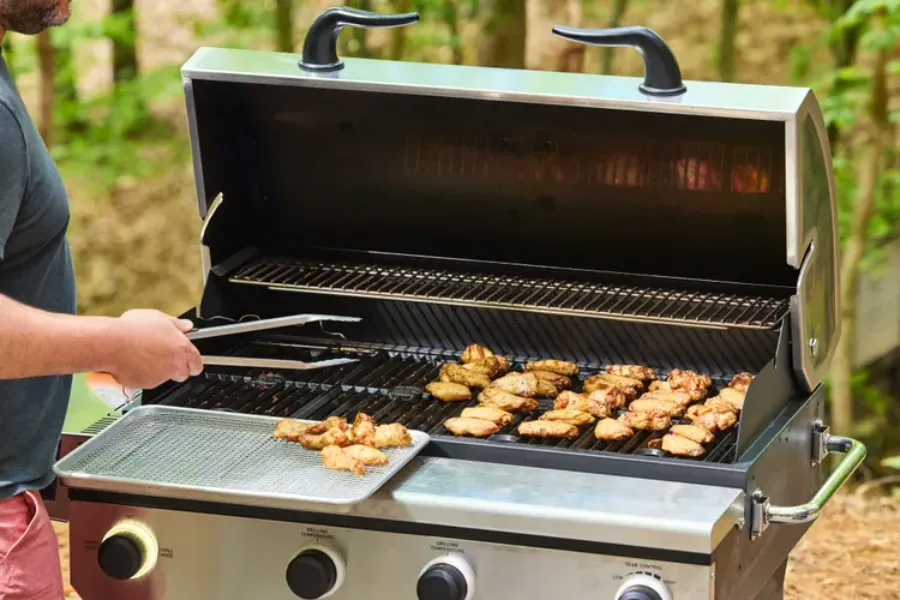 4 months
How a Connected Grill Line Hit 98.5% First-Pass Yield Without Losing a Single Shift
A connected grill line reached 98.5% first-pass yield in four months — without giving up a single unit of shift output.
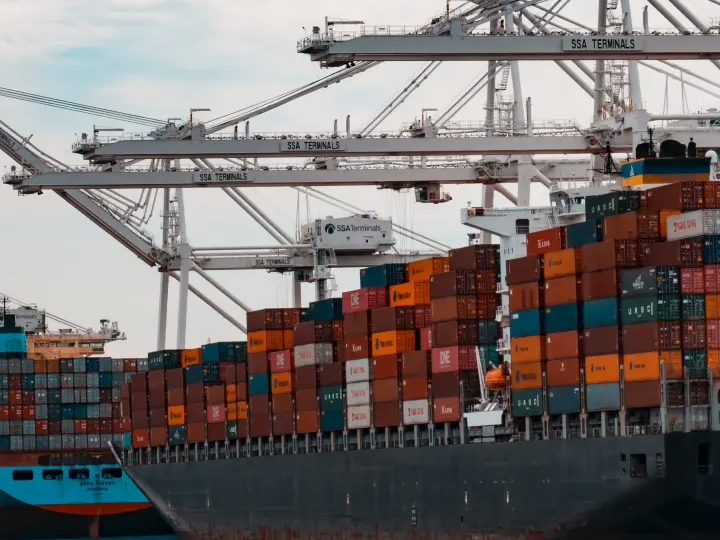 3 months
How an Outdoor Products Maker Defended $320K of Margin Through a Steel Price Surge
A Shenzhen outdoor-products maker locked steel before the Q4 spike and protected $320K of margin against spot-market pricing.
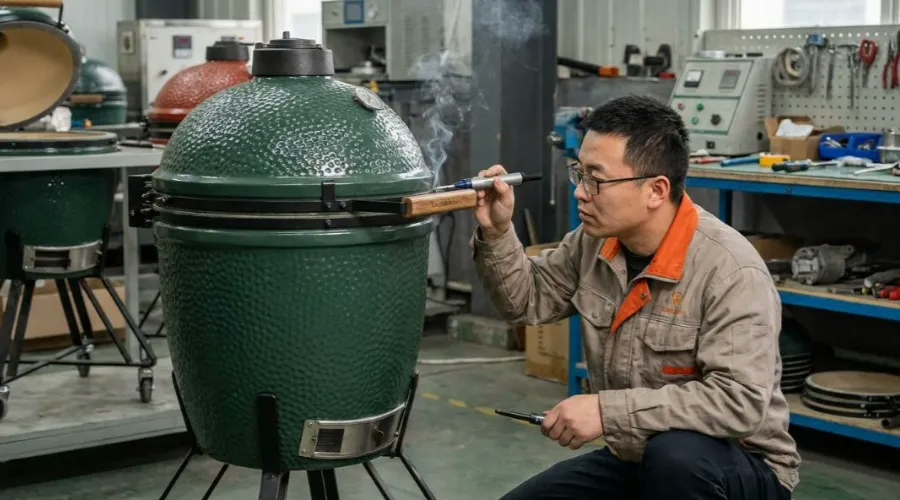 90 days
How a National Hardware Chain Cut Kamado Seal Failures from 8% to 0.4% in 90 Days
A national hardware chain cut ceramic micro-fractures from 8% to 0.4% in 90 days by rebuilding kiln cooling control.
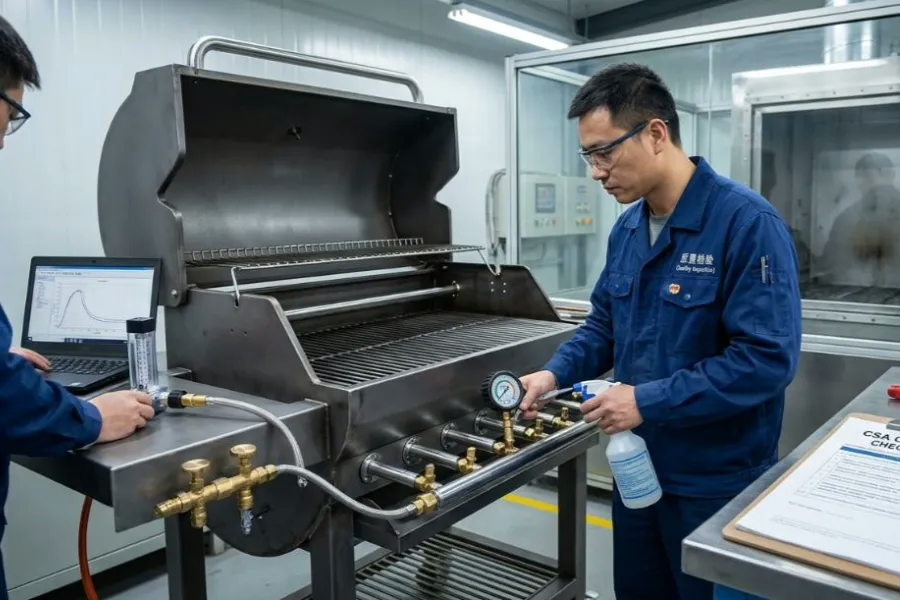 14 days
How a North American BBQ Brand Saved 6 Weeks and Cleared Global Certification First Time
A North American BBQ brand recovered six weeks of spring-launch schedule and passed global certification on the first submission.
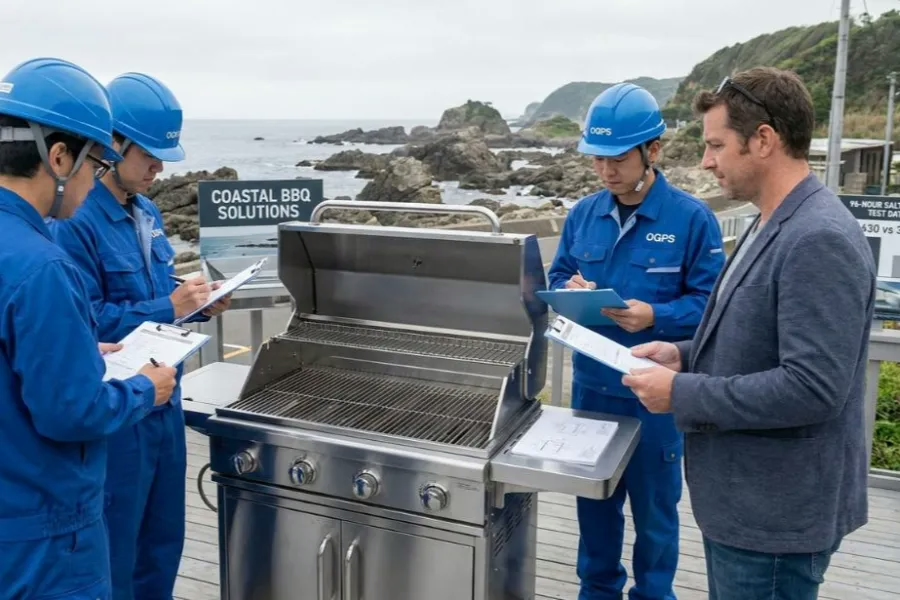 3 weeks
How 96 Hours of Salt-Spray Testing Ended a Coastal Rust Warranty Crisis
96 hours of salt-spray testing proved that a component-level 304 upgrade ended a coastal rust warranty crisis.
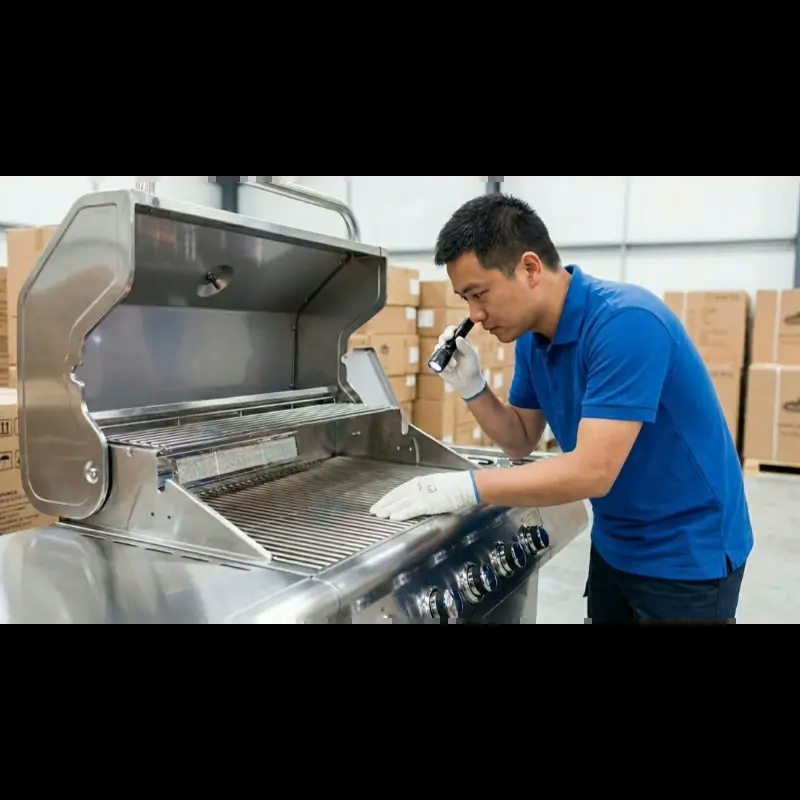 48 hours
How a Halted Assembly Line Kept 5,000 Defective Gas Grills Out of the U.S. Market
A line-stop and a rewritten AQL defect library kept 5,000 defective gas grills out of the U.S. market.
No case studies in this category yet.
The Buyer’s
Sourcing Checklist.
The six gates our engineers check on every program — supplier vetting, sample approval, in-line QC, packaging validation and consolidated FCL loading. Print it and run it against your own suppliers.
Questions About These
Case Studies.
Most of these programs run under NDA. We describe each client by the detail that actually matters — industry, product, market, and annual volume — instead of a name, so the numbers stay useful without exposing anyone. Full client names and reference calls are available under NDA once we are working together.
Every figure is taken straight from the written case study it belongs to. Where a number was modelled rather than measured, the case study says so. We publish the tradeoffs alongside the wins rather than a best-case summary.
The method transfers; the numbers do not. A locked component specification, a validated sample, and a written inspection standard do most of the work. Tell us your category, target market, and annual volume and we will map the specific failure points your program is exposed to before any tooling is cut.
Programs above $400K in annual procurement. Below that level a standard agent is usually the better fit, and we will tell you so. Above it, a dedicated manufacturing partner pays for itself through consolidated containers, per-SKU compliance, and a single accountable point of contact.
A production fix — a defect rate, a material spec, a certification failure — is typically measured in weeks, not quarters; several of the cases above were resolved inside 90 days. New OEM tooling and packaging validation run on a project schedule confirmed after sampling, with standard platform SKUs shipping 6–8 weeks from spec freeze.
OGPSGroup engineers, not a call centre. Our team buys its own test equipment, takes no factory commissions, and reports the hard numbers — including the tradeoffs. Where a case is anonymised, the engineering detail is left in on purpose: it is the part you can verify.
Have a similar
challenge?
Tell us your category, target market, and annual volume. We will show you the same factory-level rigor these programs ran on — and where your risk actually sits.
Qualification: annual procurement $400K+. Enterprise programs only.