Social media statistics are measurable signals of audience reach, engagement and buying intent across platforms. For outdoor furniture brands, they matter because saves, searches and shares often move before quote requests and purchase orders do. Read correctly, they tell you when to reserve materials, book production slots or hold stock and wait.
This is not a consumer social media primer. It is written for e-commerce founders, supply chain leaders and procurement directors buying patio furniture, outdoor seating, pergolas and related outdoor living products. The market context is large: the U.S. Census Bureau estimates retail e-commerce reached $340.2 billion in Q2 2026, or 17.1% of total retail sales, up 12.2% year on year.
This guide combines third-party platform research with OGPSGroup’s day-to-day experience of sourcing outdoor furniture. Third-party figures are linked to their sources. Practical recommendations are labeled as our operating view, not as universal rules.
Social Media Statistics Outdoor Furniture Brands Should Know
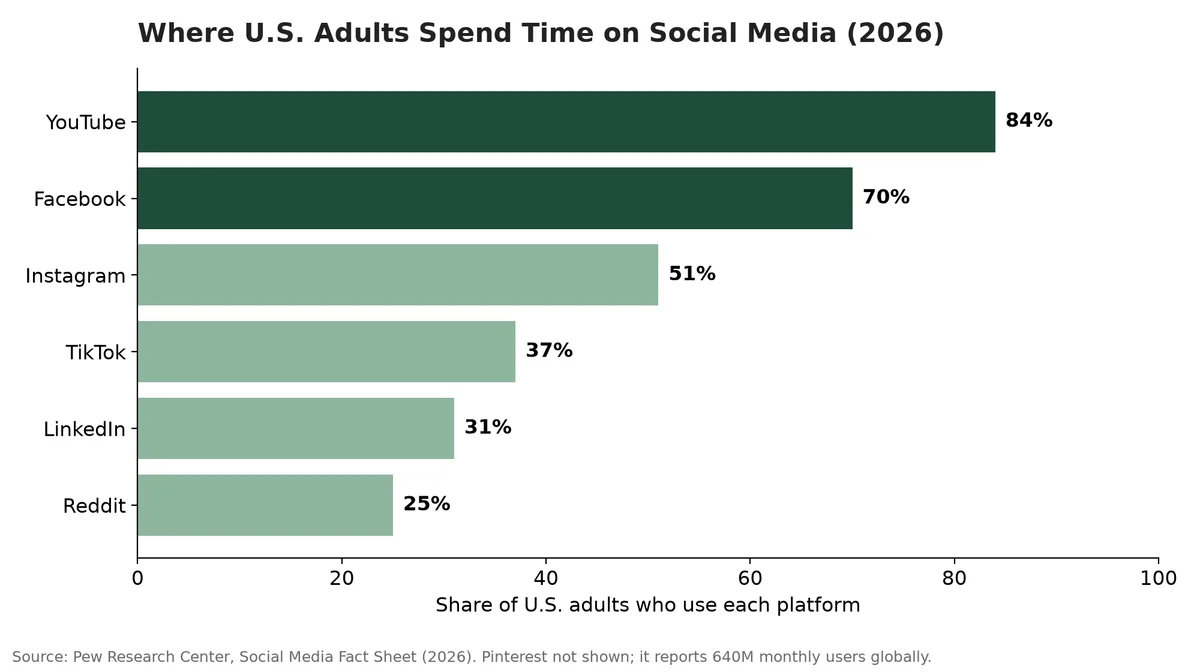
Platform reach decides where demand shows up first. These are the figures worth knowing before you plan a season.
| Platform | U.S. adult usage (Pew, 2026) | Role in outdoor furniture buying | Metric to watch |
|---|---|---|---|
| YouTube | 84% | Category research, assembly and review videos | Watch time, comment themes |
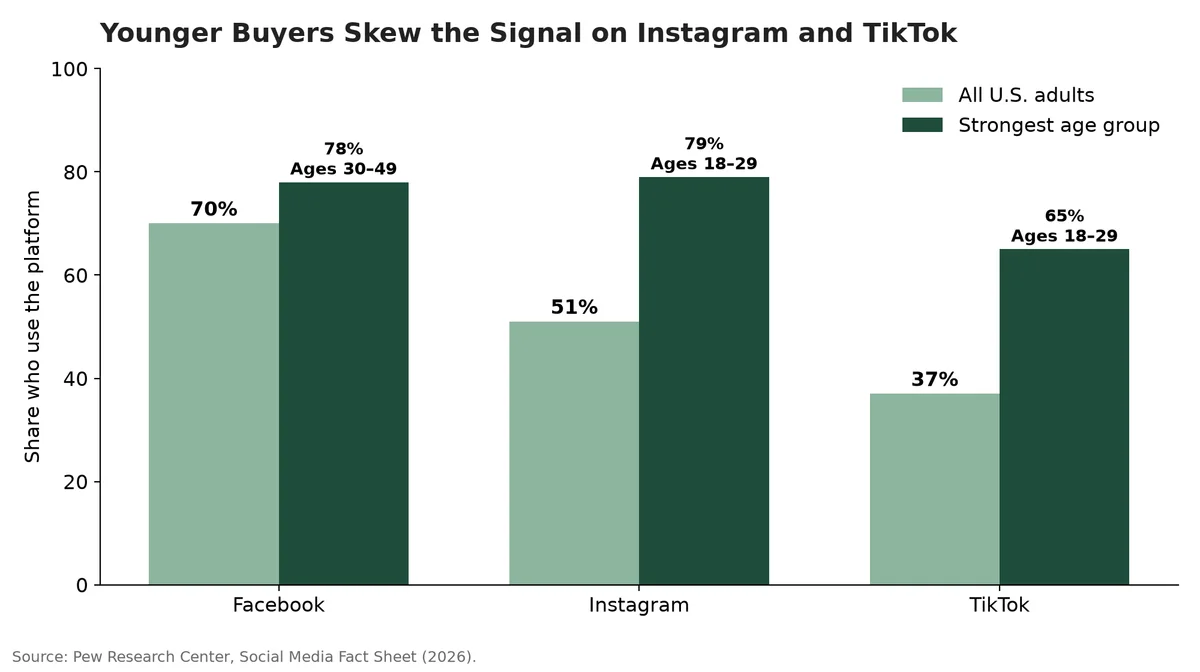
| 70% | Broad awareness, 30–49 age group (78%) | Shares, group discussions | |
| 51% | Style discovery, 18–29 (79%) | Saves, product tag clicks | |
| TikTok | 37% | Viral SKU velocity, 18–29 (65%) | Search lift, Shop sales |
| 31% | Supplier trust and B2B validation | Inquiry quality, profile visits | |
| 25% | Honest product complaints | Recurring defect themes | |
| 640M monthly users globally | Early aesthetic and seasonal signals | Saves, search growth |
Sources: Pew Research Center, Social Media Fact Sheet (2026); Pinterest Business, accessed October 2026.
A few more numbers frame the scale:
- DataReportal counts 5.81 billion social media “user identities” as of October 2026, or 69.9% of the world’s population, though it cautions that these may not be unique people.
- GWI data cited by DataReportal shows the typical user visits 6.66 platforms a month and spends 19 hours 18 minutes a week on social media. Demand signals are scattered, so no single platform tells the whole story.
- Pinterest says 96% of its top searches are unbranded, and that it reaches 40% of U.S. households earning more than $150,000 a year. Shoppers there are still choosing, which makes it an early read on style and finish.
- Among U.S. adults with household incomes of $100,000 or more, 45% use LinkedIn (Pew, 2026). That is where a supplier’s credibility gets checked.
What Are Social Media Statistics?

For buyers, social media statistics answer two questions: where demand lives, and whether it turns into a quote request, dealer inquiry or container order. In outdoor furniture sourcing, they fall into three layers.
- Platform reach data shows who uses each network, by age, income and region. Weight it by your target market.
- Category-demand data tracks what consumers save, search, share or discuss around patio sets, lounge seating, dining sets, umbrellas and pergolas.
- Commercial-intent and sourcing data covers supplier discovery, inquiry quality, product-page clicks, wholesale lead forms and recurring discussion themes.
Not every metric carries the same weight:
- Visibility metrics: impressions, reach, views.
- Engagement metrics: saves, shares, comments, watch time.
- Intent metrics: clicks, add-to-cart behavior, quote requests, dealer inquiries.
- Procurement signals: recurring feature requests, material preferences, accessory bundles, shipping or assembly complaints.
A statistic is useful only with context, timing and a business outcome attached. A million views without saves rarely becomes a container order.
💡 Key Insight: Separate visibility from decision metrics, then tie decision metrics to sourcing outcomes.
Core Workflow: From Signal to Supply Action
A view count never moved a container. Value appears when a signal triggers a decision: reserve aluminum, open a backup line, or hold stock and watch. In practice, saves and searches tend to move first, quote requests follow, and purchase orders land last. That lag is the opportunity.
1) Assign Each Platform a Job
Platforms are not interchangeable. Each feeds a different part of the buying system.
- YouTube and Facebook build broad awareness and category-level demand.
- Instagram and TikTok drive fast discovery and viral SKU velocity, with high speed and low durability. TikTok reports that U.S. TikTok Shop sales grew 120% year on year and names sports & outdoors among its top categories (TikTok Newsroom, accessed October 2026). In a Meta-commissioned Ipsos study of 14,473 holiday shoppers, 86% said they use social media for inspiration (Meta for Business).
- Pinterest surfaces early aesthetic signals: seasonal styling, collection naming and patio room scenes. Its Spring 2026 Trend Report shows searches for “garden inspiration ideas” up 940% and “balcony makeover ideas” up 165%, a sign that demand is shifting toward compact balcony and bistro sets.
- LinkedIn carries B2B trust, supplier discovery and engineering credibility. Forrester’s 2026 research, based on more than 17,000 business buyers, ranks social media as the second most meaningful information source for B2B buyers, behind only generative AI search tools.
- Reddit and YouTube comments expose product friction. Faded cushions, peeling powder coat on aluminum frames and brittle PE rattan are recurring complaints. When a theme repeats, the fix belongs in the spec sheet: solution-dyed fabric, a stated salt-spray test hour for powder coating, and UV-tested virgin HDPE rattan.
2) Climb the Demand-Sensing Ladder
Raw views sit at the bottom. Actionable signals sit at the top.
- Attention signals: views, reach, saves, search lift, creator reposts.
- Preference signals: comments on color, material, size, configuration and bundles.
- Commerce signals: clicks, quote requests, retailer inquiries, add-to-cart lift, waitlist signups.
- Supply signals: sample requests, PO acceleration, shorter reorder cycles, cushion and cover demand, packaging-change requests.
Higher rungs carry less noise. A viral video with flat conversion is entertainment. A modest video with climbing quote requests is in demand.
🔄 Common Misconception: High views equal high demand. Often views spike, conversion stays flat, and the brand over-orders.
3) Build the Forecast Model

Compile one scorecard every week. Combine trend velocity, search lift, ad click-through rate, landing-page conversion and inquiry rate into a single reading. Then check that reading against three constraints: existing stock cover, supplier lead time and material risk.
⚙️ Technical Detail: Calculate trend velocity as the seven-day change in saves plus search volume, indexed against the prior four-week baseline.
Seasonality sets the calendar. Google Trends data for “patio furniture” in the U.S. (2021–2026) shows interest climbing from February, peaking in April–May and bottoming out in December. With sea freight and production lead times added, spring orders need to be placed in autumn and winter, long before the peak shows up online. (Google Trends values are relative interest, not search volume.)
Fix the thresholds in advance, so nobody argues mid-spike:
- Small spike: hold and monitor.
- Sustained two- to three-week lift: reserve raw materials and packaging.
- Viral spike plus conversion lift: lock production slots, expand inspections and review freight mode.
4) The Operable SOP
Run this sequence when velocity changes. It fits both e-commerce founders and enterprise procurement teams.
- Confirm whether the spike is attention, intent or sales.
- Review finished-goods stock and open POs.
- Check long-lead materials and single-source components, such as aluminum extrusions, rattan colors and cushion fabric.
- Reserve flexible production windows before a backlog forms.
- Reset the inspection plan: pre-production, inline, pre-shipment, packaging and drop tests, plus load and stability checks on seating and tables.
- Send only accessories, such as cushions and covers, by air. Keep the bulky assortment on sea freight.
- Update retailer ETAs and bundle plans.
Key Benefits for Founders, Supply Chain Leaders and Procurement Directors
Detect Demand Earlier

Social signals arrive before ERP history catches up. A sustained rise in Pinterest saves and TikTok searches can flag a surge weeks before reorders appear, which gives time to reserve aluminum, rattan, fabric or cartons before lead times stretch.
Plan Products and Assortments Smarter
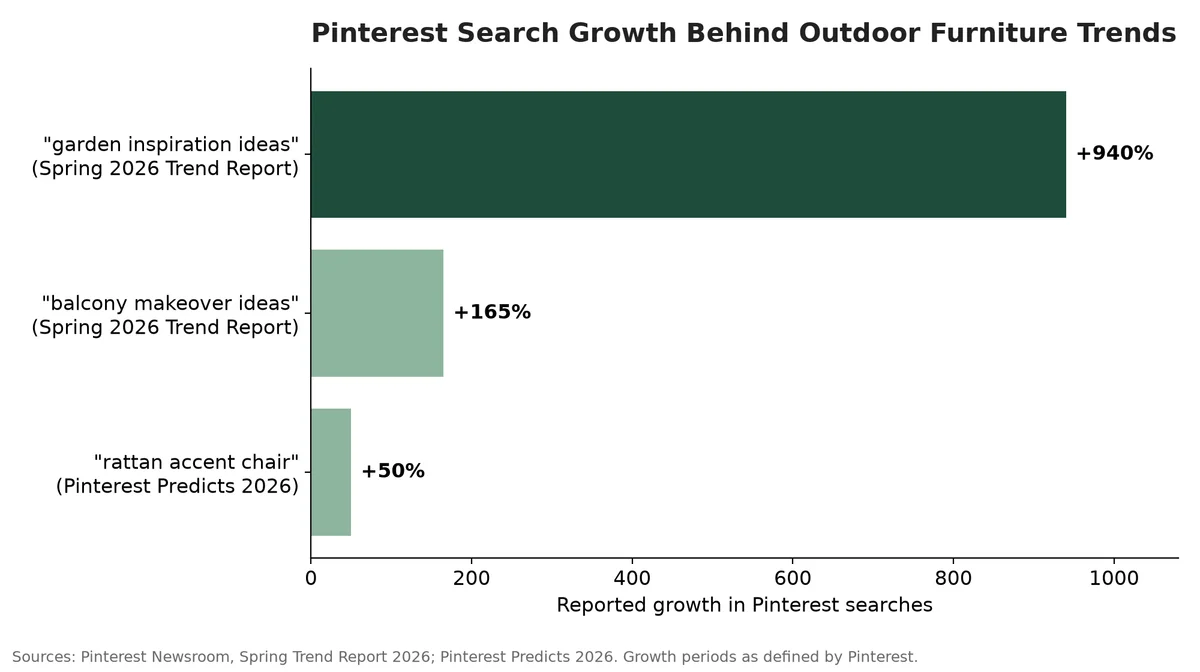
Pinterest searches and comment themes guide finishes, colorways, material mixes and accessory bundles. Pinterest Predicts 2026 records a 50% rise in searches for “rattan accent chair,” the kind of signal worth testing with a small sample run before committing to a full colorway.
Differentiate Suppliers Through B2B Signals
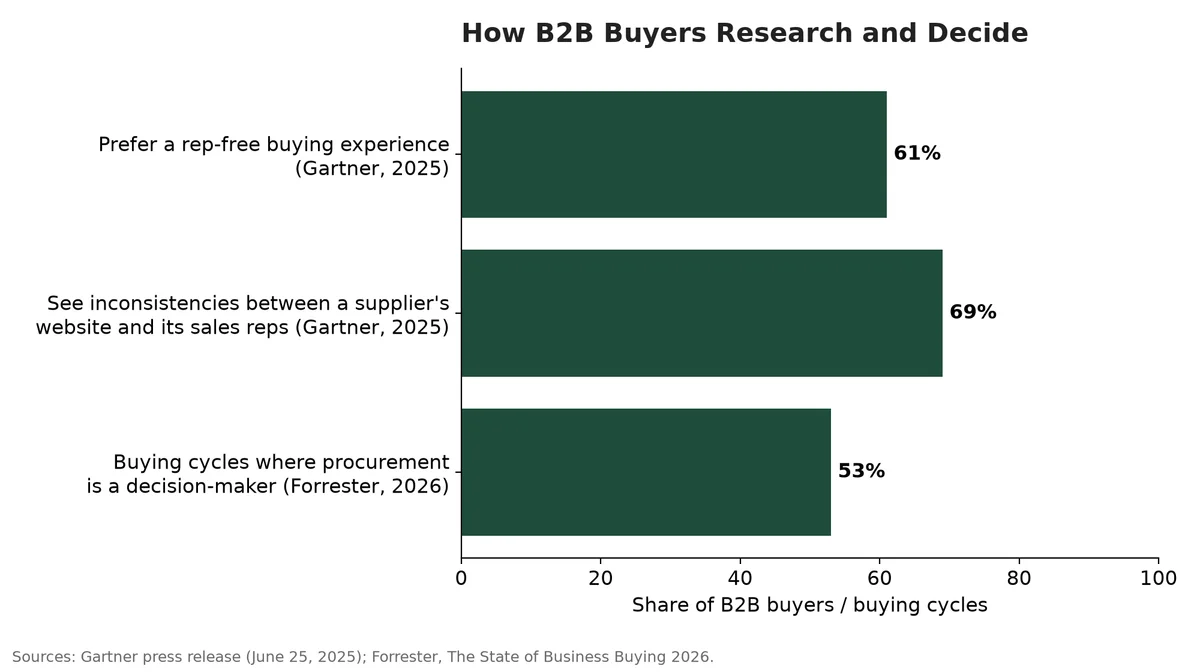
Buyers increasingly research suppliers on their own. Gartner (2025) found that 61% of B2B buyers prefer a rep-free buying experience, and 69% see inconsistencies between a supplier’s website and what its sales reps tell them. Forrester (2026) finds a typical B2B purchase involves 13 internal stakeholders and nine external influencers, with procurement as decision-makers in 53% of buying cycles.
The practical answer is consistent, public technical proof: specification sheets, audit summaries and real production footage that match what sales says. OGPSGroup publishes its manufacturing and sourcing model for the same reason.
Plan Containers and Production with Less Guesswork
Validated demand lets you consolidate freight earlier. Outdoor furniture usually fills a container’s volume before its weight limit, so pairing dense items such as gas grills with flat-pack chairs and tables makes better use of a 40HQ. Mixed loads only pay off when demand signals justify the volume on both sides.
📈 ROI Check: Track your signal-to-order lag weekly. The shorter it gets, the less you rely on expedited freight.
Honest Constraints and Friction Points
Social media statistics are signals, not guarantees.
Attention Does Not Equal Purchase Intent
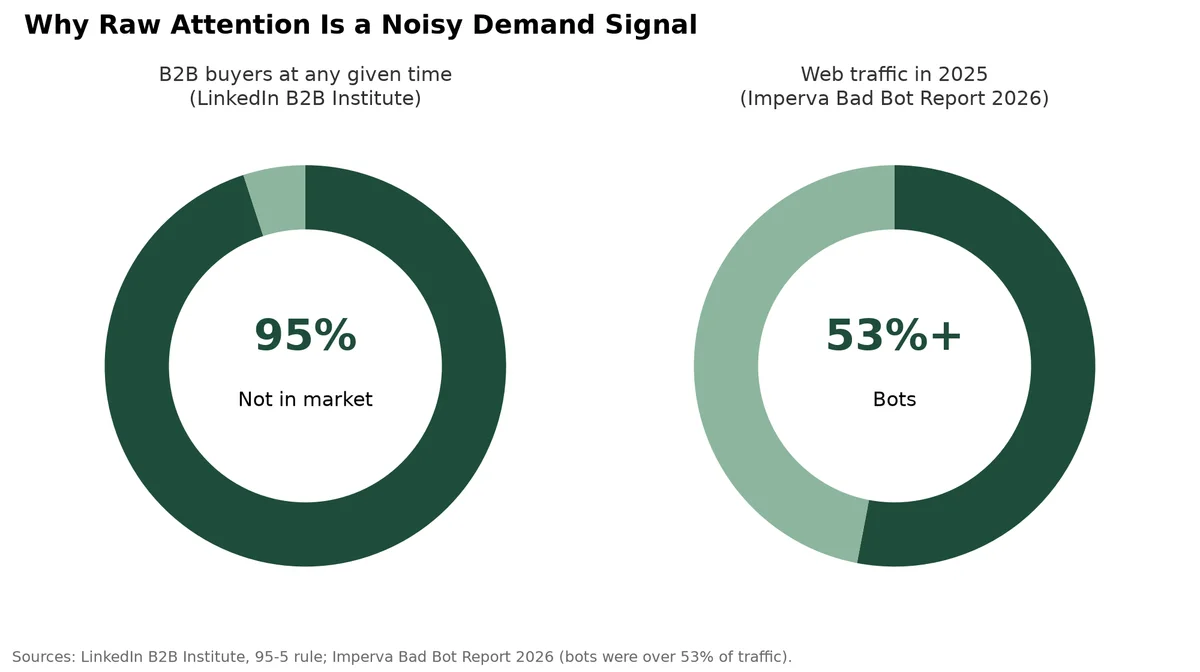
Saves often reflect aspiration. People save dream patios long before they buy, and most remain browsers. LinkedIn’s B2B Institute estimates that 95% of potential B2B buyers are not in the market at any given time, so a spike in attention is not a spike in orders.
Platform Data Can Be Distorted
Self-selection, demographic skew, creator effects, bots and algorithms all warp platform data. Imperva’s 2026 Bad Bot Report finds that bots made up more than 53% of all web traffic in 2025. Fake engagement is also a legal issue: since October 21, 2024, the FTC’s final rule has banned buying or selling fake social media influence indicators, such as bot-generated followers or views.
Correlation Is Not Causation
Viral trends do not guarantee sales. Weather shifts and retail promotions drive orders too. Social media data alone is never enough. Cross-check every viral spike against real search volume, and confirm inventory levels before placing a large factory deposit. Data limits risk, but it never eliminates it.
Supply Chains Cannot Pivot Overnight
Factories cannot double output on demand. New tooling and molds commonly take several weeks, and that lead time is a capacity limit, not a negotiating tactic. Compressing it too hard cuts curing and inspection time, which is where defects come from, especially on aluminum frames and powder-coated finishes.
🛡️ Mitigation Strategy: Triangulate social data with search demand, site analytics, sell-through, retailer feedback and open inquiry volume. Use threshold-based response plans, release POs in phases, and add inspection gates during demand spikes.
Final Thoughts
Social media statistics are not a marketing scorecard. They are a sourcing early-warning system, most valuable when they connect audience behavior to forecast accuracy, sourcing confidence and operational readiness.
Three takeaways:
- Platforms play different roles: TikTok for velocity, Pinterest for aesthetics, LinkedIn for trust, Reddit for friction.
- The useful statistics are tied to thresholds and actions, not vanity dashboards.
- Social data works best alongside internal order data, supplier capacity and QA discipline.
Set your thresholds now (small spike: hold; sustained lift: reserve; viral plus conversion: lock production), and build a supplier escalation and inspection SOP before the next spike, not during it.
If you want help turning demand signals into supply chain readiness, contact the OGPSGroup team.
People Also Ask About Social Media Statistics
-
Which social media platform best predicts outdoor furniture demand?
Pinterest and TikTok usually move first. Pinterest shows style and finish preferences early, while TikTok shows viral velocity. Neither predicts orders alone, so confirm with search trends and inquiry volume.
-
How far ahead of peak season should outdoor furniture brands act on social signals?
U.S. search interest in patio furniture peaks in April–May. Once production and sea freight are counted, decisions on materials and production slots usually need to be made in the autumn and winter before.
-
Are TikTok and Instagram views reliable demand data?
Not on their own. Views measure attention, and bot traffic and fake engagement distort them. Saves, search lift and quote requests are stronger signals.
-
Do B2B buyers really use social media to find suppliers?
Yes. Forrester’s 2026 research ranks social media as the second most meaningful information source for B2B buyers, behind only generative AI search tools.
Disclosure: This article cites third-party research and OGPSGroup operating experience. Third-party sources are linked. The Meta and TikTok figures come from studies the platforms commissioned or published themselves. Our recommendations are practical guidance, not universal rules.

- Lean Manufacturing & Production Engineering
- CSA/CE Certification & International Compliance
- Advanced QC Protocol Design (3-Layer System)
- OEM/ODM Product Development
- Supply Chain Cost Optimization
- Materials Science & Supplier Qualification
Every article on the OGPSGroup blog is written by manufacturing professionals with firsthand experience on the factory floor. Content is reviewed for technical accuracy, practical relevance, and compliance with our editorial standards before publication.
Learn more about our Fact Checking Process and Editorial Policy.